The first version of this post (on this site, at least) provides the full explanation of how and why this series exists, but the same two disclaimers from the first part of this year’s edition apply to this one as well: “more guns = more ‘gun violence'” is not my hypothesis, and I am not setting out to prove causation.
As with last year’s update, I am using the usual sources: the FBI’s Uniform Crime Report for 2015, the Centers for Disease Control, the Small Arms Survey of 2003, the BATFE’s Firearms Commerce in the United States, and Radical Gun Nuttery.
So, have the “gun control” extremists’ pipe dream of “more guns = more ‘gun violence'” finally come true?
You probably already know the answer.
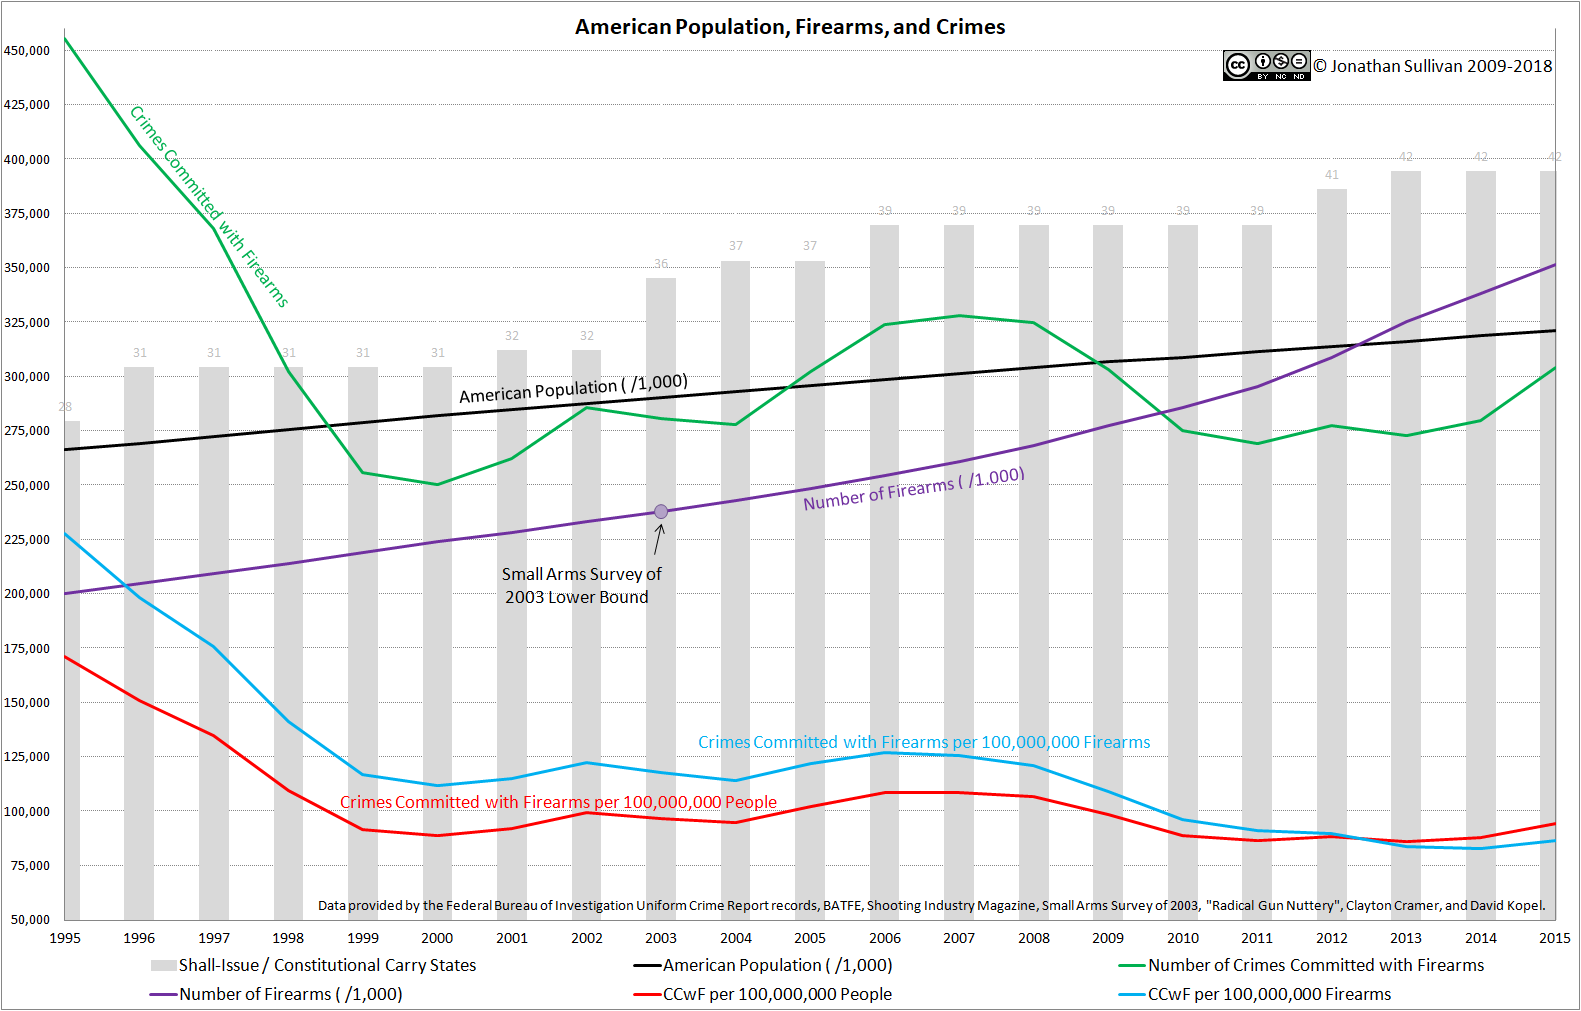
The rate of average firearm ownership in America and the rate of crimes committed with firearms correlates with a coefficient of -0.734, indicating a strong, negative correlation between the two.
The raw number of firearms in America and the raw number of crimes committed with firearms correlates with a coefficient of -0.40019, indicating a negative correlation between the two.
In other words, the hypothesis of “more guns = more ‘gun violence’ remains false. Still.
(Feel free to check my work (*.xlsx file).)
(Important note: It has come to my attention that comparing, for example, this year’s correlation numbers to last year’s correlation numbers will be inherently flawed, on account of both the FBI and the CDC going back and updating/correcting/etc. information up to five years in the past. The most-recent “graphics matter” post will have the most-recent information from both sources, but the previous years’ information from last year’s posts may have been updated/changed. I do not know how, for example, the CDC managed to misrecord the US population from four years ago, but it is a little annoying.)
